Have you ever wondered what exactly happens once a visitor lands on your website? Do they find what they’re looking for, or do they leave frustrated ? If you’ve been guessing how your website is performing, it’s time to stop. Welcome to the world of Google Analytics 4 (GA4).
In this guide, I’m going to break down GA4 into simple, bite-sized pieces. No heavy jargon-just a clear roadmap to help you understand your audience better than ever before.
What Exactly is GA4?
Google Analytics (GA4) is a web analytics tool that helps you track and analyze user behavior on your website. It records various user actions such as clicks, scrolls, and purchases. This data provides valuable insights into how users interact with your website, helping you understand their behavior and improve overall performance.
What If Your Website Was a Store?
Imagine you own a beautiful clothing showroom, and I am visiting it. To make your business successful, you wouldn’t just sit in the back office, right? You would want to see exactly what’s happening on the floor.
Think of GA4 as a smart CCTV system you’ve installed in your store.
As the owner, you can now see:
- My Journey: Which section did I walk into first-the new arrivals or the clearance sale?
- My Interest: Did I pick up a dress (click) just to look at the price, or did I actually take it to the trial room?
- The Gaps: Did I leave the store empty-handed because I couldn’t find my size?
In the same way, GA4 records every user interaction on your website. It’s not just about counting hits, it’s about watching the “live movement” of your visitors. It tells us the story behind the numbers so we can stop guessing and start improving.
From Sessions to Events: The Biggest Shift in GA4
The biggest change in GA4 is the shift from a session-based model (used in Universal Analytics) to an event-based model. In the older system, the focus was mainly on sessions, whereas GA4 focuses on tracking every user interaction as an event.
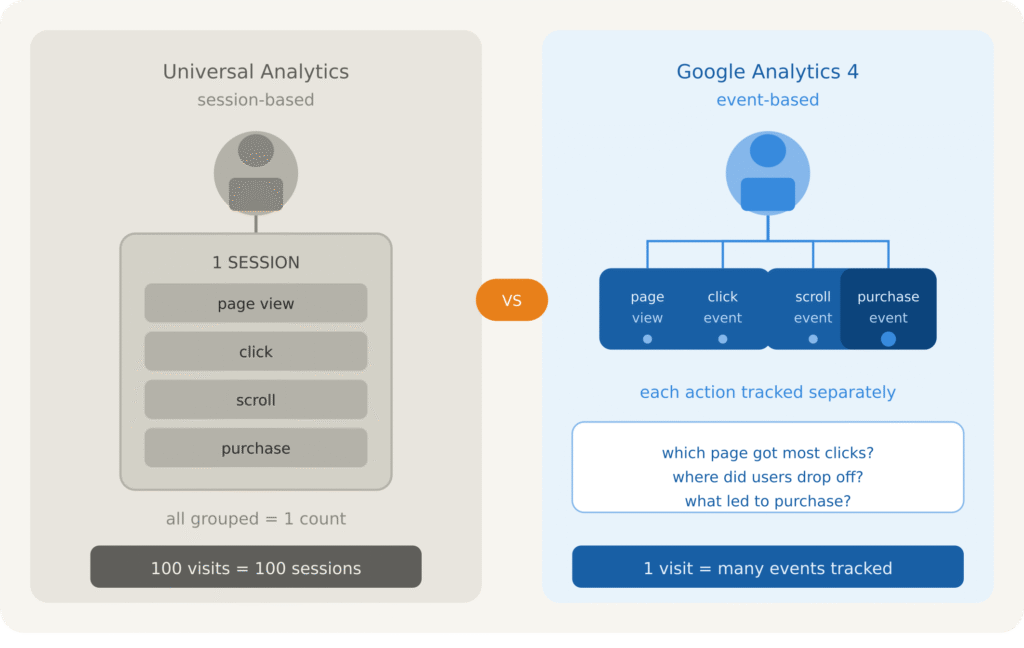
Session: A session refers to the entire journey of a user from the moment they visit your website until they leave. Even if a user performs multiple actions during this time, it is still counted as a single session. By default, a session lasts for 30 minutes, but this duration can be customized based on your requirements.
But what exactly do users do during a session? That’s where events come in.
Event: Every action that a user performs on your website like scrolling, clicking a button, visiting pages etc. are all considered an event. For example, if a user visits an e-commerce website and clicks on a “Buy Now” button, GA4 records this as an event.
Similarly, if the user scrolls through the product page, adds a product to the cart, and completes the purchase, each of these actions is tracked as a separate event. This helps you understand:
- Which products are getting more clicks
- Where users are dropping off
- And which actions are leading to conversions
Earlier, analytics tools mainly focused on sessions, which only measured the number of visits to a website. However, GA4 tracks events, meaning every single user interaction is recorded. This allows for a much deeper understanding of user behavior and helps in making better data-driven decisions.
How Google Analytics (GA4) Works
So now you know what GA4 is – but how does it actually work behind the scenes? Let me walk you through the complete process, step by step.
GA4 follows a simple but powerful journey: it collects data from your website and converts it into meaningful insights that help you understand exactly how your users are behaving.
Step 1: Install the Tracking Code
Before GA4 can do anything, you need to add a small piece of code – called the GA4 tracking tag – to your website. Think of it as placing a silent observer on your site. The moment someone visits, this code wakes up and starts monitoring everything in the background.
Step 2: A User Visits Your Website
As soon as a user lands on your site, the tracking code gets to work. It immediately picks up basic details like their device type (mobile, desktop, or tablet), their location (country/city level), and how they found you – whether through Google Search, social media, or a direct visit.
Step 3: The User Starts Interacting
Now the real action begins. As your user clicks buttons, scrolls through pages, watches videos, or fills out forms – every single move is being observed.
Step 4: Events are Recorded
Here’s where GA4 is different. Every interaction I just mentioned? GA4 records each one as an individual event. Page views, clicks, scrolls, video plays, purchases – all tracked separately, giving you a much deeper picture than older tools ever could.
Step 5: Data is Sent to GA4 Servers
All those recorded events don’t sit on your website – they’re automatically sent to Google’s servers in real time, ready for the next stage.
Step 6: Data Processing
Once your data reaches GA4’s servers, it gets organized, filtered, and analyzed. GA4 also uses machine learning here to improve the quality and usefulness of what you’re seeing.
Step 7: Reports are Generated
Now comes the part you actually see – your dashboard. GA4 converts all that raw data into easy-to-read reports showing you your number of users, how they’re engaging, where they’re coming from, and how much revenue you’re generating.
Step 8: You Make Smarter Decisions
This is the whole point. With these insights in hand, you can improve your website’s performance, optimize the user experience, and make better marketing decisions – all backed by real data, not guesswork.
GA4 takes up to 24-48 hours to process data. So if you don’t see results immediately after setup – don’t panic, just wait.
Key Features of Google Analytics (GA4)
GA4 isn’t just an upgrade – it’s a completely new way of thinking about digital data. Here are the standout features that make it such a powerful tool:
- Event-Based Tracking Model: I’ve already talked about this, but it’s worth repeating – because it changes everything. Instead of grouping actions into sessions, GA4 treats every single user interaction as its own event. This gives you incredible flexibility to track specific things like button clicks, file downloads, or video plays in much more detail.
- Enhanced Measurement: One of my favourite time-saving features in GA4 is Enhanced Measurement. You don’t need to write any extra code or set up complex tags – GA4 automatically tracks common interactions for you, including scrolls (when a user reaches the bottom of a page), outbound clicks (when they leave your site via a link), site searches, and video engagement.
- Cross-Platform Tracking (Web + App): Here’s something really powerful – GA4 lets you track users across both your website and your mobile app. Using Data Streams, you can follow a user who browses your products on their phone but completes the purchase on their laptop. You get one unified view of their entire journey.
- AI-Powered Predictive Insights: GA4 doesn’t just show you what happened – it can actually predict what’s going to happen next. Using Google’s machine learning, it gives you insights like Purchase Probability (which users are most likely to buy soon), Churn Probability (who might stop visiting), and Revenue Forecasting (estimated income based on current trends).
- Privacy-Centric Design: With strict privacy laws like GDPR and CCPA now in place, GA4 is built to work even in a cookieless world. When users opt out of cookies, GA4 uses Behavioral Modeling to fill in the gaps.
For example, if 100 users visit your site but 30 block cookies, GA4 studies the remaining 70 and estimates what those 30 users likely did – so your data stays accurate while respecting privacy.
- Free BigQuery Integration: Previously, exporting your raw data to BigQuery (Google’s cloud data warehouse) was only available to premium GA4 360 users. Now it’s free for everyone. This means you can store your data long-term and run advanced analyses whenever you need.
GA 4 Vs Universal Analytics: Which one wins ?
Let’s compare GA4 and Universal Analytics side by side to understand how both platforms differ in terms of features, tracking approach, and overall capabilities.
| FEATURES | UNIVERSAL ANALYTICS | GOOGLE ANALYTICS 4 |
| Tracking Model | Session-based | Event-based |
| App Tracking | No | Yes |
| AI Insights | No | Yes |
| Privacy Ready | No | Yes |
| BigQuery | Paid only | Free |
| Cross-platform | No | yes |
So, what do you think? Which one looks more powerful to you? If you look closely, GA4 clearly stands out with its advanced features, flexible tracking, and future-ready approach.
GA4 Dashboard: 4 Key Reports Explained
Once your GA4 is set up, the real work begins – and that work is reading your data the right way.
Honestly, when you open GA4 for the first time, all those numbers, graphs, and menus can feel a little overwhelming. But here’s the thing – you don’t need to understand everything at once.
GA4 organizes all your data into 4 main reports. Each report answers one important question about your website. Master these 4, and you’ll always know exactly what’s happening with your audience.
Let’s break them down one by one.
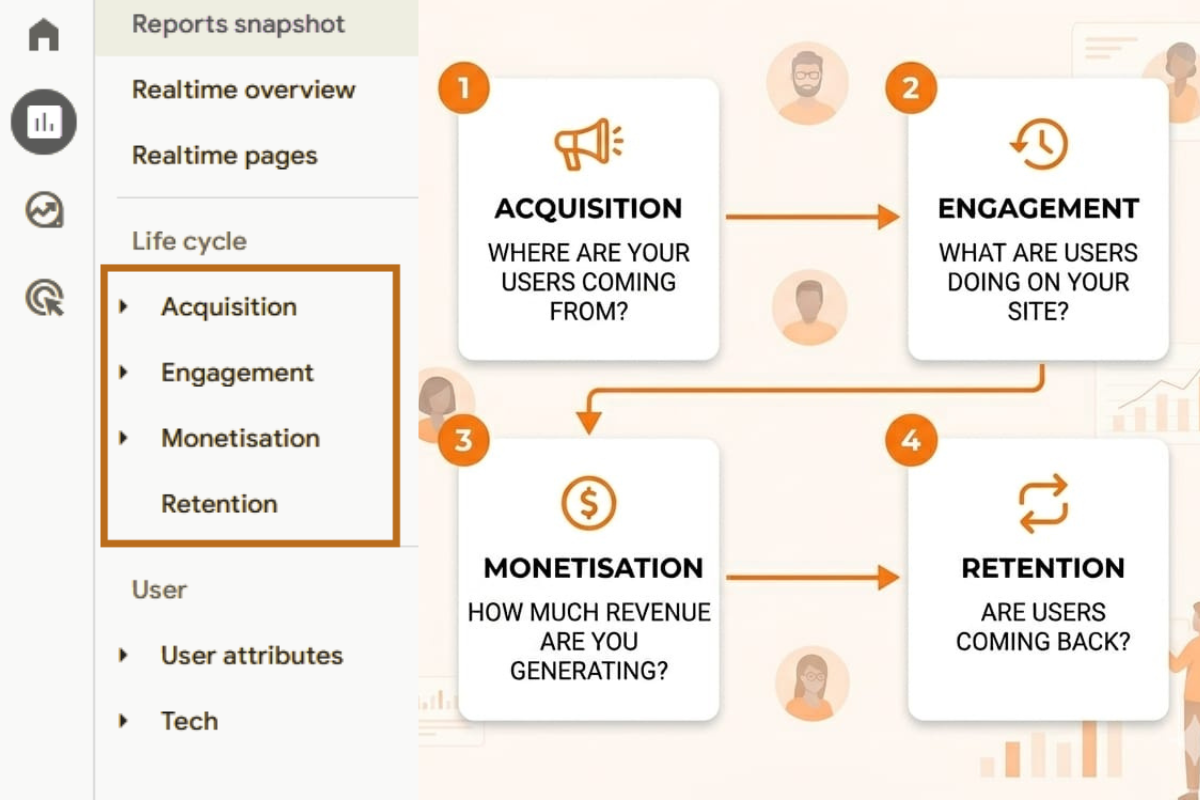
1. Acquisition: Where are your users coming from?
This report tells you how people find your website. Whether they came from a Google Search (Organic), a Social Media post, or clicked on a Paid Ad, this section helps you identify which marketing channel is performing best.
2.Engagement: What are users doing on your site?
This is the heart of GA4’s event-based model. It shows you which pages are most popular, how long people stay, and specific actions they take like clicking a “Contact Us” button or watching a video.
3. Monetization: How much revenue are you generating?
If you run an e-commerce store or sell digital products, this report is crucial. It tracks your total revenue, successful purchases, and the average value of each customer
4. Retention: Are users coming back?
A successful website doesn’t just get new visitors; it keeps them coming back. The Retention report shows how often users return to your site after their first visit.
What is Data Stream in GA4?
A Data Stream in GA4 is basically the starting point of your data. Think of it like a bridge that connects your platform (your website or app) to GA4, so that you and I can track and understand what users are actually doing.
Let’s say you have a website. You want to know things like:
Are people visiting your site? What pages are they checking? How long are they staying?
That’s exactly where a Data Stream comes in.
In GA4, you’ll find three types of Data Streams:
- Web Stream: You’ll use this when you want to collect data from your website.
- Android Stream: This is for tracking Android mobile applications.
- iOS Stream: And this one is used for iOS applications.
Now when you create a Data Stream, GA4 gives you a Measurement ID (it looks like G-XXXXXXX) along with a tracking code. Here’s what you need to do next – you install that tracking code on your website or app.
For example, if you add it to your website, every time someone visits, clicks a button, or browses a page, GA4 quietly starts recording that activity in the background.
Once everything is set up, GA4 automatically collects all this data and shows it to you in your reports, so you can clearly see how users are interacting with your platform.
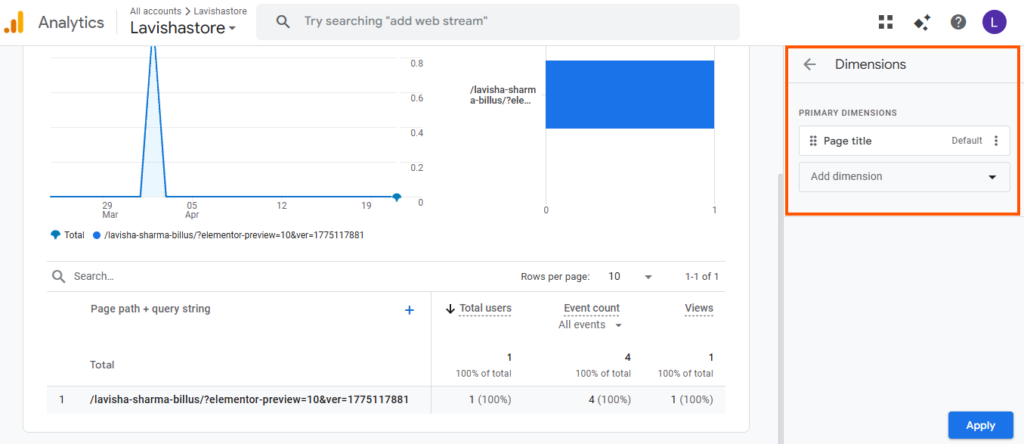
Understanding Dimension and Metrics in GA4
In GA4, data is presented in two main forms: Dimensions and Metrics. These help you understand not just what is happening on your website, but also how much of it is happening.
Dimension: Dimensions are descriptive attributes of your data. Dimensions tell you about the characteristics of your users and their interactions. They help you understand “what” or “which”.
Examples:
- Page Title
- Country
- Device Type
- Traffic Source
Metrics: Metrics are numerical values that measure data. Metrics show the quantity of user interactions on your website.They answer “how many” or “how much”.

Examples:
- Number of Users
- Sessions
- Page Views
- Active users
Dimensions and Metrics work together to give meaningful insights. For example, you can see how many users (Metric) visited your website from India (Dimension).
What are Conversions in GA4?
Think about it – what action do you actually want a visitor to take on your website? That action is called a conversion in GA4.
Conversions in GA4 refer to important actions that you want users to complete on your website or app. These actions are valuable for your business and help measure success.
For example, common conversion actions include:
- Making a purchase
- Filling out a contact form
- Signing up for a newsletter
- Downloading a file
The key thing to understand is that in GA4, any event can be marked as a conversion. This gives you full flexibility to track the specific actions that matter most to your business, instead of relying on predefined goals.
Once a conversion is set up, GA4 tracks how many users complete that action. This helps you clearly understand what is working, where users are dropping off, and what needs improvement.
In simple terms, traffic shows how many people are visiting your website, but conversions show how many of them are actually taking meaningful action.
Not every event should be marked as a conversion. Only track key actions that matter to your business, otherwise your data may become confusing.
Conclusion: Making GA4 Work for Your Website Growth
I know Google Analytics 4 can feel complex when you first open it, but once you understand the basics, you start seeing how powerful it actually is for your website growth. Unlike older versions, GA4 focuses on events, which helps you track user actions more accurately and in a way that truly reflects real behavior.
As you start connecting data streams, dimensions, metrics, and conversions, you’ll notice how everything begins to make sense. You’re no longer guessing what works-you’re making decisions based on actual user behavior and insights.
If you give it some time, explore the dashboard, and experiment with different reports, you’ll gradually build confidence. And once you get comfortable, you’ll realize that GA4 isn’t just another analytics tool-it becomes one of the most valuable assets for improving your website’s performance.