Core Web Vitals have been around since 2020 – but most website owners still don’t fully understand what they are or how they affect Google rankings. And honestly? That’s a problem. Because while you’re busy creating content, your competitors with faster, smoother websites are quietly ranking above you. I’ve broken it all down right here – simple, no jargon, straight to the point. Let’s get into it.
Let Me Start With Something You’ve Probably Experienced
You’re hungry. You Google “best pizza near me,” click the first result, and… wait. The page loads halfway. Then a big ad pops in and pushes the menu down just as you were about to tap it. You accidentally click the ad instead. You close the tab and never go back.
Sound familiar? That restaurant just lost a customer – not because the pizza was bad, but because the website experience was frustrating.
THINK OF IT THIS WAY : Imagine going to a restaurant. The food might be amazing, but if you waited 20 minutes just to see the menu, the service is slow, the floor is sticky, your glass keeps tipping over and your chair kept wobbling – you’d leave a bad review. A slow website is the same thing.
So in 2020, Google decided to measure these bad experiences – and turn them into a score. They called it Core Web Vitals. And yes, this score affects where your website shows up on Google.
What Are Core Web Vitals?
Core Web Vitals are just three simple questions Google asks about your website:
- Largest Contentful Paint (LCP) – How quickly does the largest visible element on the page appear?
- Interaction to Next Paint (INP) – How fast does it respond when someone clicks?
- Cumulative Layout Shift (CLS) – Does the page stay still, or does stuff jump around?
That’s it. Three questions. Three metrics.
Why Should You Care About This?
Because Google uses these three scores as a ranking factor.
Meaning – if your website and your competitor’s website have equally good content, the one with better Core Web Vitals will likely show up higher on Google. It’s that simple.
And it’s not just about rankings. A fast, smooth website means people stay longer, trust you more, and are more likely to buy from you or come back.
How Does Google Even Know This?
Here’s the interesting part – Google doesn’t just run a test on your site. It collects real data from real people who visited your website using Chrome.
So when Google gives your page a score, it’s based on how your actual visitors experienced it. Not a robot. Not a simulation. Real people, real frustration.
That’s what makes Core Web Vitals impossible to fake. You have to actually fix the problem.
The 3 Core Web Vitals Explained – And What Google Is Actually Measuring
Now that you know what Core Web Vitals are, let’s get into each one. I’ll keep it simple – what it means, what a good score looks like, why it goes wrong, and how to fix it. No developer degree required.
LCP (Largest Contentful Paint) – How Fast Does Your Page Actually Load?
Imagine you click on a website and start counting in your head – one, two, three… When does the main content finally appear? The big headline, the hero image, the thing that tells you “yes, I’m on the right page”? That wait time is your Largest Contentful Paint.
It’s not about when the page starts loading. It’s about when the most important part of your page becomes visible to the user. And that difference matters a lot.
THINK OF IT THIS WAY : You walk into a restaurant and sit down. The waiter shows up quickly – but just to tell you “the menu is on its way.” You wait. And wait. That’s a bad LCP. A good LCP is the menu arriving the moment you sit down.
| LCP Score | Rating |
|---|---|
| Under 2.5 seconds | Good |
| 2.5 – 4 seconds | Needs Improvement |
| Above 4 seconds | Poor |
- Large, uncompressed images
- Slow server response time
- Heavy JavaScript blocking the page
- No CDN being used
- Compress images (use WebP format)
- Use a CDN like Cloudflare
- Enable browser caching
- Use a faster hosting provider
If your LCP is above 4 seconds, you’re losing visitors before they even get a chance to see what you’re offering. This is the metric I’d fix first – it has the biggest impact on both user experience and your Google ranking.
A slow LCP isn’t just a technical problem. It’s a first impression problem. And you only get one of those.
INP (Interaction to Next Paint) – Does Your Page Actually Respond When Someone Clicks?
Here’s a scenario I’m sure you’ve experienced. You click a button on a website – nothing happens. You click again. Still nothing. You start wondering if the site is broken. Then suddenly, two seconds later, something moves.
That frustrating delay? That’s exactly what Interaction to Next Paint measures. It tracks how long it takes for your page to visually respond after a user clicks, taps, or types something.
THINK OF IT THIS WAY : You press the elevator button. Nothing lights up. You press it again. And again. Then five seconds later it lights up. You have no idea if it’s coming or not. That uncertainty is exactly what a bad INP feels like on a website.
| INP Score | Rating |
|---|---|
| Under 200 milliseconds | Good |
| 200 – 500 milliseconds | Needs Improvement |
| Above 500 milliseconds | Poor |
- Too much JavaScript running in background
- Heavy third-party scripts (chat widgets, ads)
- Unoptimised event handlers
- Long tasks blocking the main thread
- Remove or defer unused JavaScript
- Limit third-party scripts
- Break long tasks into smaller ones
- Use a lighter page builder
INP replaced FID (First Input Delay) in March 2024 – because Google felt INP gave a more complete picture of how your page responds throughout the entire visit, not just on the first click. Google has been making a lot of changes to how it measures and ranks websites – if you want to stay updated, check out the latest SEO updates I cover every month.
If your page doesn’t respond fast, users don’t wait. They assume it’s broken – and they leave.
CLS (Cumulative Layout Shift) – Is Your Page Stable, or Does Everything Keep Jumping Around?
You’re reading an article. You’re halfway through a sentence. Suddenly – the whole page jumps down. An ad loaded above the content and pushed everything out of place. You’ve lost your spot. Or worse – you were just about to click “Add to Cart” and the button shifted. You accidentally clicked something else.
That jump is called a layout shift. And CLS measures how much of that happens on your page from the moment it starts loading to when you’re done scrolling.
THINK OF IT THIS WAY : Imagine reading a physical book – and every few seconds, someone randomly pulls a page out and inserts it somewhere else. You’d give up. That’s exactly what a high CLS score feels like to your visitors.
| CLS Score | Rating |
|---|---|
| 0.1 or below | Good |
| 0.1 – 0.25 | Needs Improvement |
| Above 0.25 | Poor |
- Images without width & height defined
- Ads loading late and pushing content
- Custom fonts swapping after load
- Dynamically injected content
- Always set image dimensions in HTML
- Reserve space for ads before they load
- Use font-display: swap for custom fonts
- Avoid injecting content above existing text
CLS is the sneakiest of the three metrics – and honestly, the most underrated. Most website owners obsess over load speed and never even think about layout stability. But here’s the thing – your page can load in under a second and still have a terrible CLS score. Speed and stability are two completely different things.
And Google treats them that way too. A jumpy page gets penalised regardless of how fast it loads. That slight frustration, that moment of confusion when something moves unexpectedly – it adds up. And it quietly pushes people away.
A stable page builds trust. A jumpy page destroys it – even if everything else is perfect.
How to Check Your Core Web Vitals Score
Good news – checking your Core Web Vitals score is actually the easiest part.
No developer needed. No complicated setup. No paid tools. Just a URL and two minutes of your time.
And honestly? Most people skip this step entirely. They spend hours tweaking their website without ever checking what’s actually wrong. Don’t do that. Check first, fix later – that’s the smarter way to do it.
I’m going to show you three free tools that Google itself recommends. Each one tells you something slightly different – so by the end, you’ll have a complete picture of exactly where your website stands.
PageSpeed Insights – Start Here
If someone asks me “where do I even begin?” – I always say the same thing. Go to PageSpeed Insights first. It’s free, it’s made by Google, and it gives you your Core Web Vitals score in about 30 seconds.
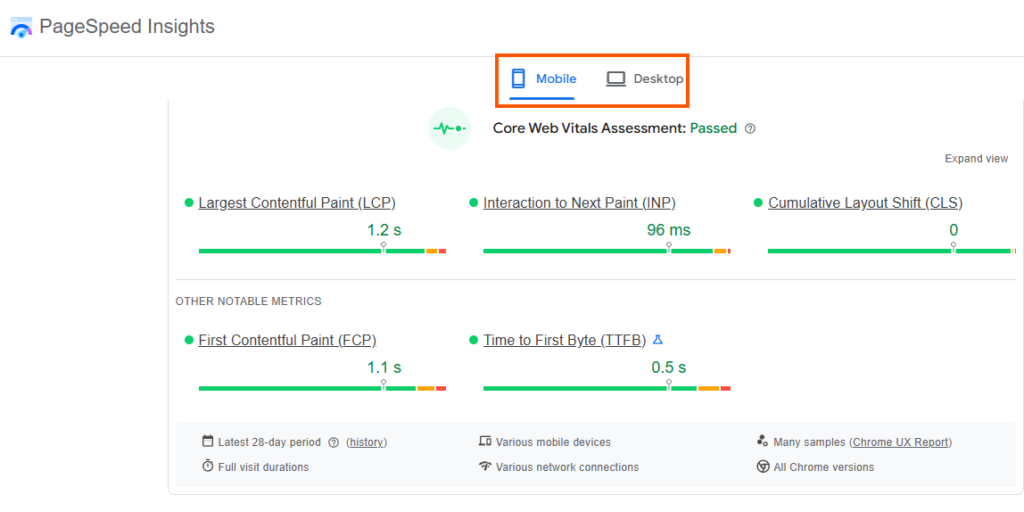
Don’t panic if your scores aren’t perfect – most websites have at least one area to improve. That’s completely normal.
PageSpeed Insights is the most beginner-friendly tool out there. If you’re just getting started, this is all you need.
Google Search Console – See Your Entire Website at Once
PageSpeed Insights checks one page at a time. But what if you want to see how your entire website is performing? That’s where Google Search Console comes in.
If you have a website, you should already have Search Console set up. If you haven’t – stop everything and do that first. It’s free and it’s one of the most powerful SEO tools available to you.
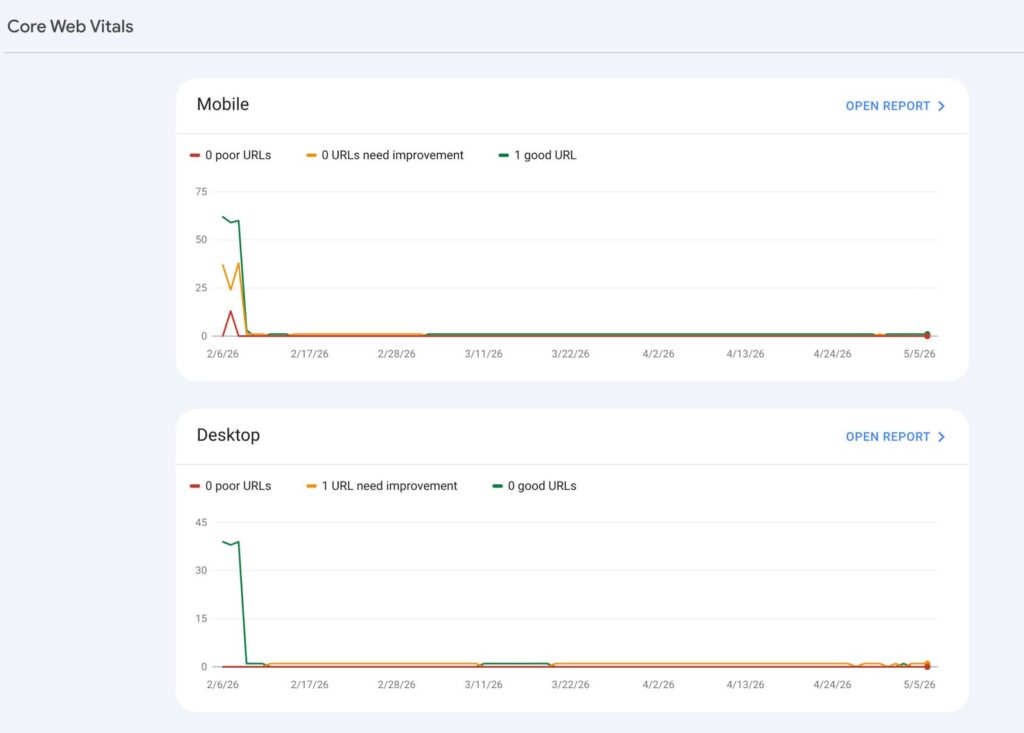
THINK OF IT THIS WAY : PageSpeed Insights is like checking the temperature of one room. Google Search Console is like checking the temperature of your entire house – room by room. Both are useful. But Search Console gives you the full picture.
Search Console is where you go when you’re serious about fixing things. It tells you which pages to prioritise and where the biggest problems are.
Once you know which pages are underperforming, you can use Google Analytics 4 to dig deeper – see how long users are staying, where they’re dropping off, and which pages are hurting your bounce rate the most.
Core Web Vitals Visualizer – Check Any Page in Real Time
This one is for when you want to check a page quickly – without going to PageSpeed Insights every time. The Core Web Vitals Visualizer extension sits in your browser and shows you live performance metrics as you browse.

This is especially useful when you’ve made changes to your website and want to quickly check if things improved – without running a full PageSpeed report every time.
Think of the extension as a speedometer in your car – always there, always showing you the number. PageSpeed Insights is the mechanic who tells you why the number is what it is.
How to Fix Your Core Web Vitals – Simple Fixes Anyone Can Do
Now that you know your scores, let’s talk about what to actually do about them. I’ll be honest with you – some fixes require a developer. But a lot of them don’t. You’d be surprised how much you can improve just by making a few simple changes. Let’s go metric by metric.
Fixing LCP – Make Your Page Load Faster
A slow LCP almost always comes down to one thing – your page is making the user wait before showing them what they came for. The good news? Most LCP problems are image problems. And image problems are easy to fix.
THINK OF IT THIS WAY : A slow LCP is like a shop that takes forever to open its shutters. The customer is standing outside, waiting. Every extra second they wait is a second they’re considering walking to the shop next door.
Start with your images. In most cases, compressing and converting to WebP alone will bring your LCP score from Poor to Good.
Fixing INP – Make Your Page Actually Respond
A bad INP score usually means one thing – too much JavaScript. Your page is so busy running scripts in the background that it doesn’t have time to respond to what the user is actually doing.
This one is slightly more technical than LCP fixes – but there are still things you can do without touching a single line of code.
THINK OF IT THIS WAY : Imagine a cashier who’s trying to serve you, answer the phone, stock shelves, and fill out paperwork – all at the same time. Everything slows down. A bad INP score means your browser is that overwhelmed cashier.
INP fixes are less about design and more about discipline – only load what you actually need on your page. Everything else is just slowing you down.
Fixing CLS – Stop Your Page From Jumping Around
CLS problems are usually the easiest to fix once you know where they’re coming from. The most common cause? Elements that load late and push other content out of the way. Images, ads, fonts – they all do this if you don’t tell them how much space to take up before they load.
THINK OF IT THIS WAY : Fixing CLS is like reserving seats before guests arrive. If you don’t reserve the space, people sit wherever they find room – and then have to shuffle around when the reserved guests show up. Reserve the space first, and nobody has to move.
CLS is the most fixable of the three metrics. In most cases, setting image dimensions and reserving ad space alone will bring your score into the green.
You Don’t Need to Be a Developer to Have a Fast Website
Core Web Vitals can sound intimidating – LCP, INP, CLS, milliseconds, layout shifts. But when you strip it all back, it comes down to something really simple: Google wants your website to be a good experience for real people. And so do your visitors.
You don’t need to understand code. You don’t need to hire a developer for every fix. You just need to know what to look for – and now you do.
Open a new tab right now and go to pagespeed.web.dev. Paste your homepage URL and run the test. Note down your LCP, INP, and CLS scores. That’s it. That’s all you need to do today. Everything else comes after.
Improving your Core Web Vitals isn’t a one-time task – it’s an ongoing process. Check your scores regularly, make small improvements, and track the difference. You’ll be surprised how quickly things improve when you know what you’re looking at.
And remember – a faster website isn’t just good for Google. It’s good for every single person who visits your site. That’s reason enough to start.
Core Web Vitals can feel overwhelming at first – but every small fix counts. If you have questions or want to share your experience, leave a comment below.